| |
-» Deutsche Version
Introduction
Measuring
medical outcomes
What is the
QL-Recorder?
Concept
Technology
Examples
Screenshots
Display of questions
Built in editor
Built in analysis tools
Fallback paper support
Printouts •
Configurations
Projects, results
Literature
About the QL-Recorder
About "Quality of life"
Live Demo
Awards
What's new?

|
|
This page...
shows you some examples of printouts generated directly with the QL-Recorder to illustrate what printouts from questionnaire administrations and statistical evaluations may look like.
You can either scroll down from here or use the menu on the left to jump to any section.
Please note: While the texts may be difficult to read in the low resolution overview, you can, click on any image to enlarge it.
Please note: A much more complete description of printouts and configuration options available with a pre-defined package for a given set of questionnaires is available in the eSIRO manuals available as PDFs on the Docs+Support page.
Please note: Should your Internet Explorer (like e.g. version 6.0.2800.1106IS available here) display the tables much too broad, a change to Mozilla (like e.g. version 1.7.12) may give you a correct rendering of the page. And (when compared with I.E. 8, Mozilla 1.x, Mozilla 3.5, konqueror) Apple's Safari may be the browser that renders downscaled printouts in the most beautiful way.
Printouts directly generated with the QL-Recorder
To view a printout in high resolution, please click onto its image. The Adobe Acrobat Reader is required to do this.
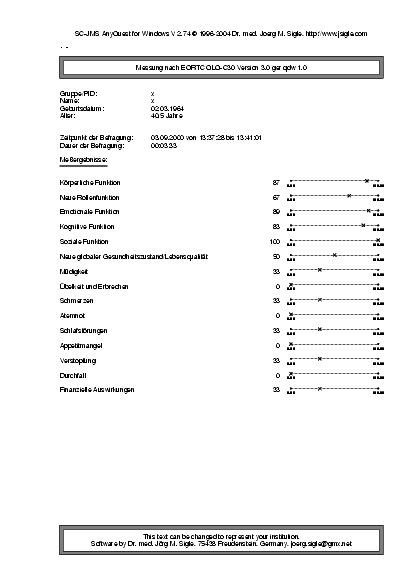 | Single printout: Results from the administration of one questionnaire in one session displayed just like laboratory values. |
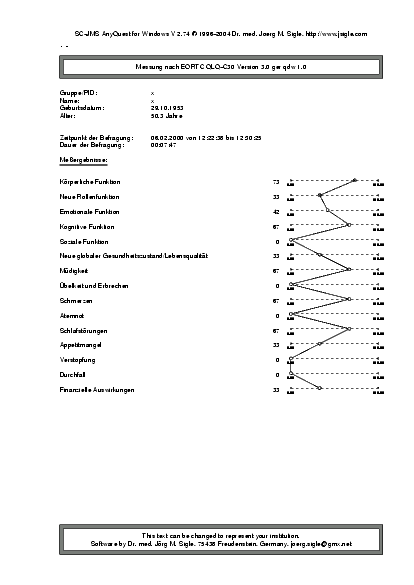 | Single printout: Results from the administration of one questionnaire in one session displayed as a quality-of-life profile. |
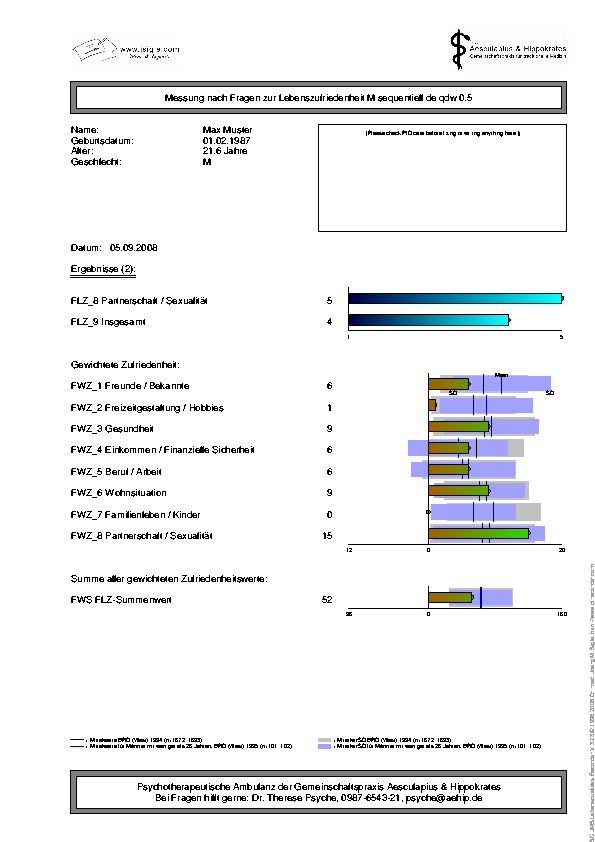 | Single printout: Results from an adoption of the "Questionnaire for Satisfaction with Life" (FLZM). This questionnaire asks, how important various areas are for a patient, and how content the patient is with these areas. Both answers are combined into a measure of weighted satisfaction. This printout illustrates the use of highly different scale ranges, with automatic positioning of axes and labels, and automatic positioning and orientation of result bars. Moreover, multiple reference ranges and reference values are overlaid: for a countrywide reference population (grey, background), and for another reference population dynamically matched to the age and sex of the patient (light blue for male, and rose for female patients, foreground overlay). Details about the automatically chosen reference population are shown in the legend. A corresponding cumulative printout is available below. Simple text files *.pds, *.rvs and *.rrs provide the necessary extended definitions, detailed information is available in the on-line help. |
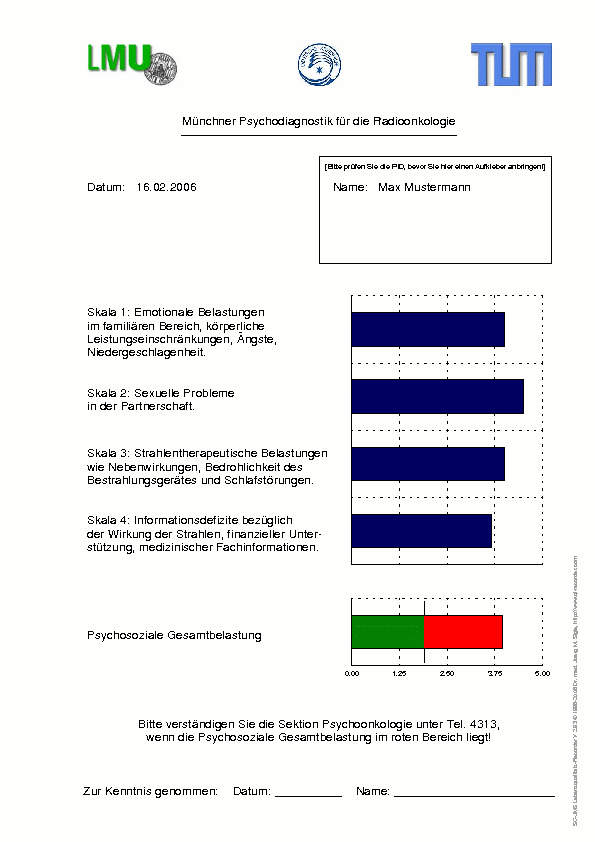 | Single printout: Results of an administration of the eSIRO in the "Münchner Psychodiagnostik für die Radioonkologie" with...
- bitmaps in header and/or footer,
- customized text in header and footer,
- grouped placement of graphs,
- customized labelling of axes,
- customized display of grids,
- customized display of reference values,li>
- colour coding of results,
- and space provided to affix a patient identification sticker,
- simplified display and positioning of patient-ID and time of measurement,
- customized text sizes and whitespaces,
- suppression of various default items,
- and other special features.
This example is from a setup where the QL-Recorder is used as a screening tool to assess the risk of patients for psychosocial distress. Screening results are immediately computed, and printed. The printout can help the physician in charge to decide whether to consult a specialist. The layout of this printout is tailored towards perfect integration into the workflow of a clinic - including the footer, which explains the criteria and the action to be taken, the number of the specialist to call, and a place for the signature of the physician in charge to document that he has taken notice of this result. If desired, even this document can be generated as PDF or Windows Journal File, so that even the signature or any other comments can be collected and stored in the electronic domain using a TabletPC. |
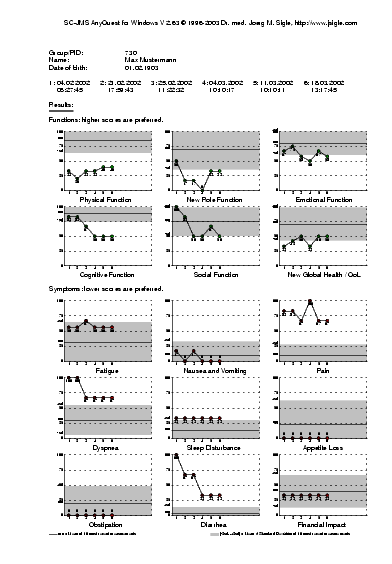 | Cumulative printout: Results from multiple administrations of one questionnaire at various times displayed as profiles. Reference values and ranges, fixed or dynamically computed, appear as lines or shaded areas. The page can be divided into sections with individual headings and color schemes for results. |
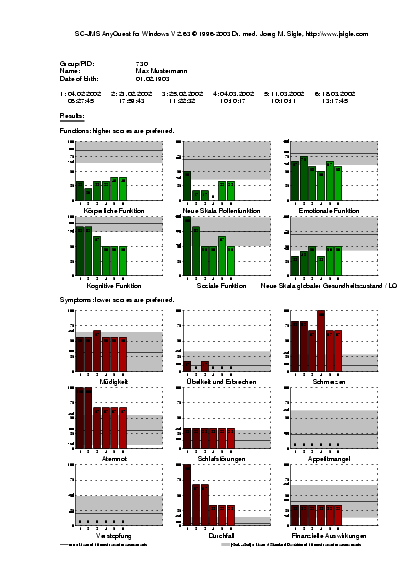 | Cumulative printout: Results from multiple administrations of one questionnaire at various times displayed as bar graphs. Reference values and ranges, fixed or dynamically computed, appear as lines or shaded areas. The page can be divided into sections with individual headings and color schemes for results. |
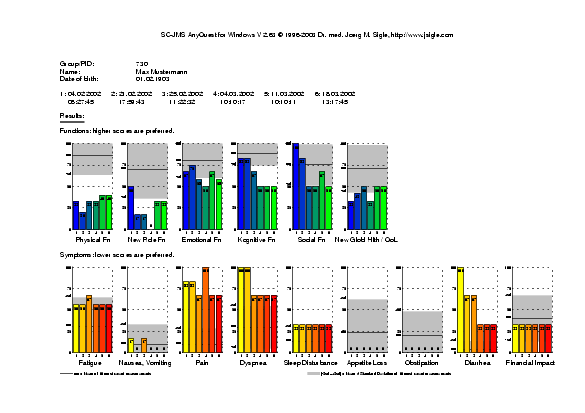 | Cumulative printout in landscape format: Results from multiple administrations of one questionnaire
at various times displayed as bar graphs. Reference values and ranges, fixed or dynamically computed, appear as lines or shaded areas. The page can be divided into sections with individual headings and color schemes for results. |
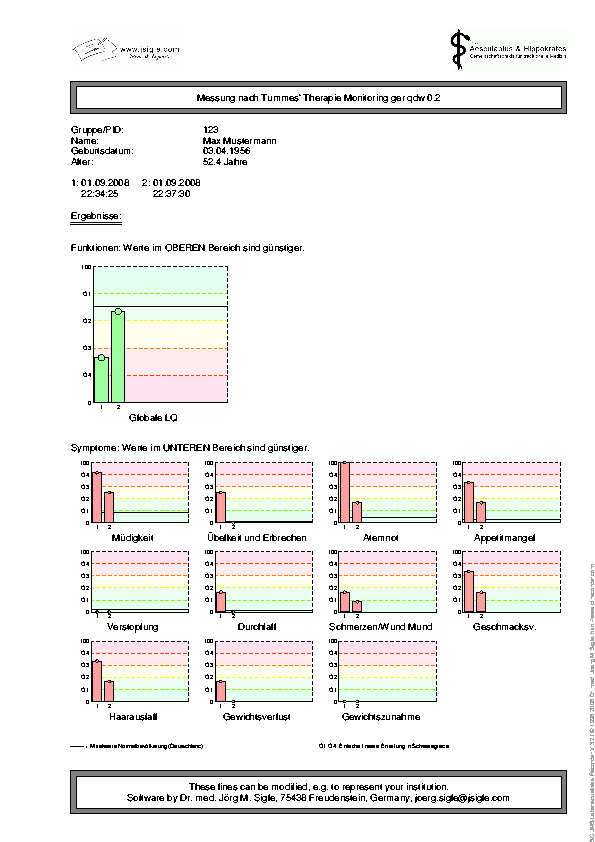 | Cumulative printout: Results from a questionnaire for monitoring of global Quality of Life and selected symptoms in oncologic outpatients, chosen from several questions of the EORTC QLQ-C30 and several modules. The printout uses multiple reference ranges (severity of symptoms, grade 0 to grade 4) and reference values (average result of a normal population), which are indicated by a background in shaded colour grades, separating lines, and labels next to the y-axis. Simple text files *.pdc, *.rvc and *.rrc provide the necessary extended definitions, detailed information is available in the on-line help. |
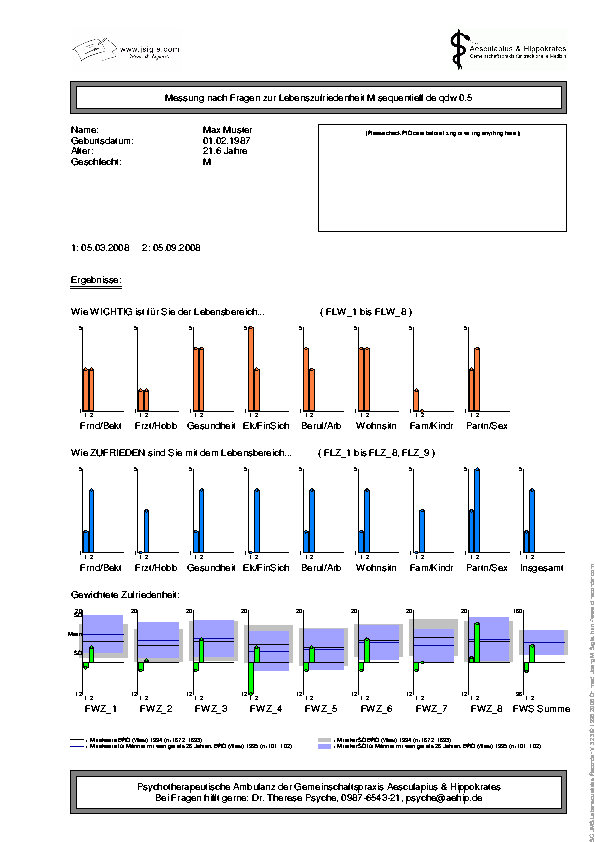 | Cumulative printout: Results from an adoption of the "Questionnaire for Satisfaction with Life" (FLZM). This questionnaire asks, how important various areas are for a patient, and how content the patient is with these areas. Both answers are combined into a measure of weighted satisfaction. This printout illustrates the use of highly different scale ranges, with automatic positioning of axes and labels, and automatic positioning and orientation of result bars. Moreover, multiple reference ranges and reference values are overlaid: for a countrywide reference population (grey, background), and for another reference population dynamically matched to the age and sex of the patient (light blue for male, and rose for female patients, foreground overlay). Details about the automatically chosen reference population are shown in the legend. A corresponding single printout is available above. Simple text files *.pdc, *.rvc and *.rrc provide the necessary extended definitions, detailed information is available in the on-line help. |
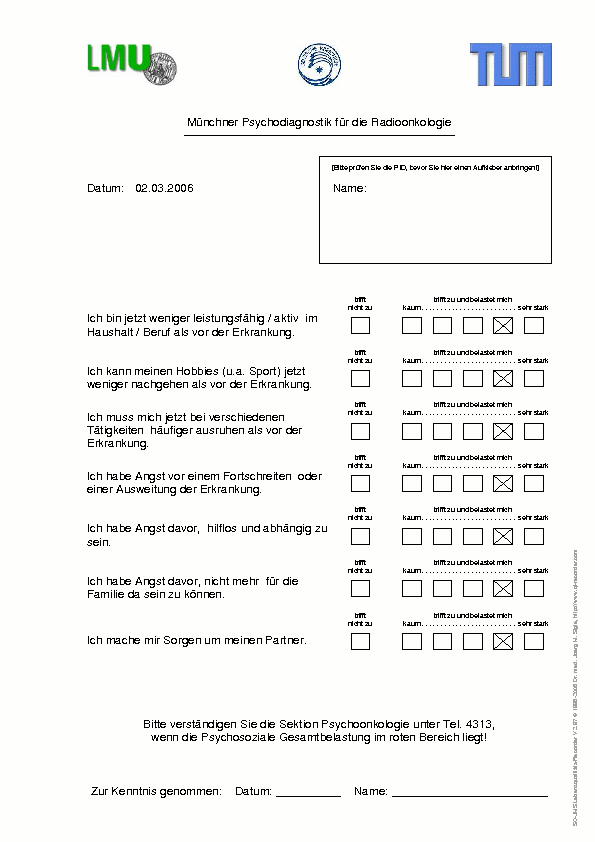 | Printout with individual answers (Questionnaire-filled-in printout): Rendering of each question with the answer the patient gave, as in the graphic screen display, equivalent to a filled in paper questionnaire (here: page 1 of 3). |
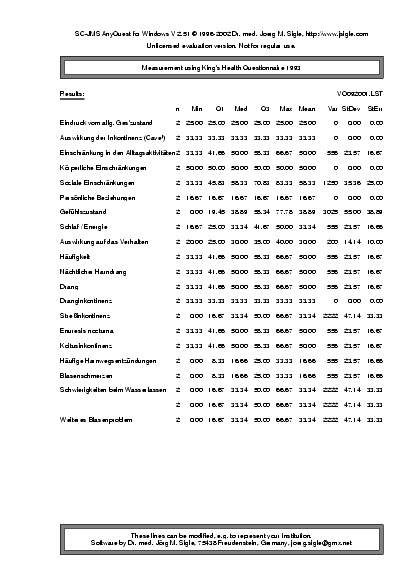 | Analysis tools printout: Basic descriptive statistics for an group interactively selected of measurements. |
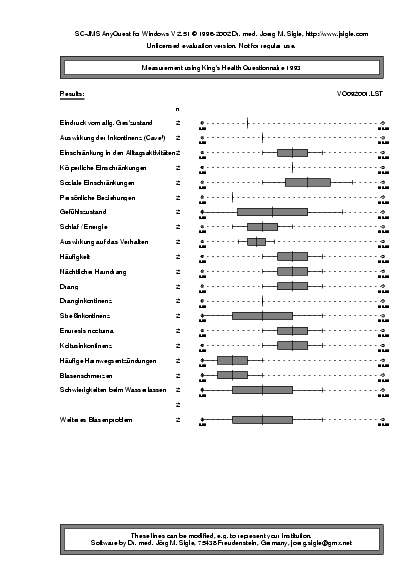 | Analysis tools printout: Box-and-Whiskers-Plots (Box-Plots) for an interactively selected group of measurements. The boxes and their whiskers indicate minimum, maximum, quartiles and median. |
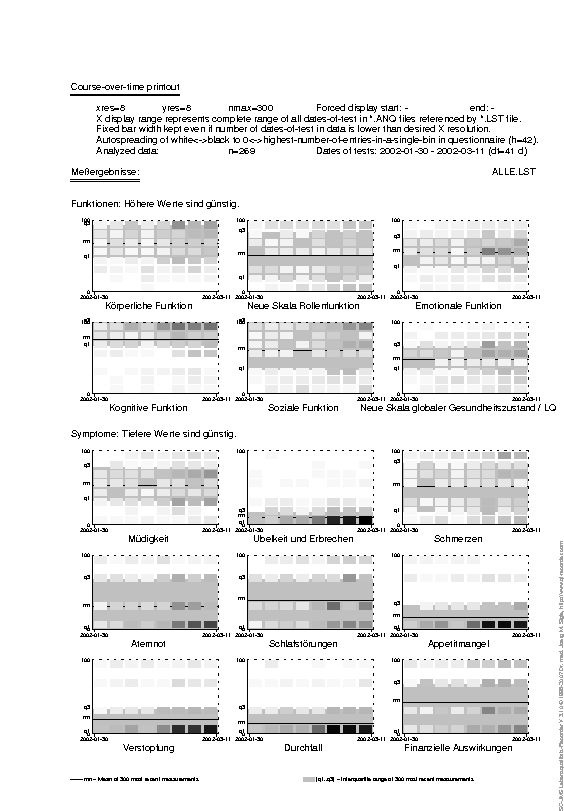 | Analysis tools printout: Course-over-time-Plot for an interactively selected group of measurements. This analysis can give an overview of the distribution of results over time. The example demonstrated here shows the interquartile range and the arithmetic mean for each result dimension at the same time. How can such a plot be read? The example to the left shows data collected over roughly 1.5 months in a practice. Measurement rates rise over time, indicated by overall darker coloured boxes (or "bins") to the right of each graph. As can be seen in the first graph, results indicating better physical health tend to appear more and more towards the end of the observation period - this could indicate the inclusion of additional, relatively healthy individuals, or the inclusion of ill individuals plus the improvement of previously included persons' health. Boxes (or "bins") in the very low range of results are there, though relatively lightly coloured, thus indicating a very low physical condition reported in some assessments. A similar result is seen for cognitive function. More problems, or fewer completely fine results, are visible in role function, emotional function, and global QoL. Among the symptoms, nausea and vomiting (Übelkeit und Erbrechen), appetite loss, obstipation (Verstopfung) and diarrhea (Durchfall) are absent in most patients, but they definitely do appear in some, and they reach high levels in a few. Dyspnea (Atemnot) is a more predominant, but sleep disturbance (Schlafstörungen), fatigue (Müdigkeit) and especially pain are highly present. In the plot for fatigue, two strains (at about 25 and at about 75) can coarsely be identified towards the end of the observation period, a similar finding appears in physical function (Körperliche Funktion). Configurable options include the bin raster resolution: Setting it to 1 for y direction and to ca. 100 for x gives a quick overview over recruitment rate vs. time; setting it to 1 for x direction and to ca. 20 for y gives a quick overview over the distribution of QoL results for the whole group of measurements throughout the whole period of data collection. |
Moreover, AnyQuest can generate e.g. overviews with layout and field coding of loaded questionnaires, and a variety of measurement-, reference-, and test printouts. As all printouts can be redirected into PostScript or PDF files, they can be automatically archived, postprocessed or included in other documents.
|
|
|


